In this post I want to explain how to handle role playing dimensions in Power BI. I wrote an article awhile ago regarding role playing dimensions in SSAS Tabular which is valid for Power BI Desktop.
To recap, in the role playing dimensions in SSAS Tabular article I explained three different solutions:
- Importing role playing dimensions several times into the model
- Creating database views in the source side (in case your source is a from of RDBMS like SQL Server, Oracle etc…) then import the data into the model
- Keep the inactive relationships in the model and create several measures to take care of different roles using USERELATIONSHIP functions in DAX
In this post I show you alternative ways for the first two solutions to handle role playing dimensions without importing data several times into the Power BI model. You also don’t have to create database views on your source database. I show you how to manage this in both DirectQuery and Import modes when connecting Power BI Desktop to a SQL Server database. I explain the third option in another post.
I used AdventureWorksDW, but, you can use any other versions of AdventureWorksDW database or you can mimic the process to your own model.
Note: If you are designing a star schema for your data warehouse you can easily create a Date dimension as explained here.
The idea is to manage role playing dimensions in Power BI Desktop itself in the easiest way possible.
Role Playing Dimensions in Import Mode
- Open Power BI Desktop
- Get data
- Select “SQL Server”
- Enter the server and database names then click OK
- Select DimDate and FactInternetSales from the list then click “Load”
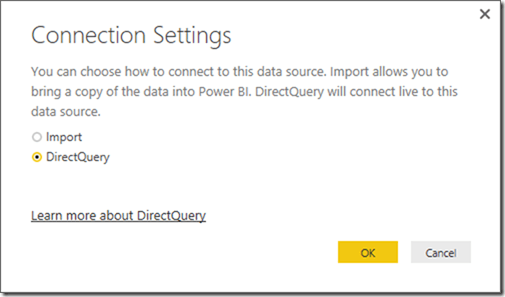
- “Import” mode is selected by default. Click OK
- Save the model
- Rename DimDate and FactInternetSales to make them more user friendly
- Create a new calculated table by clicking “New Table” button from “modelling” tab from the ribbon
- We are creating a copy of “Date” table using DAX expression. To do so just type the following DAX expression:
Order Date = All(‘Date’)
- As you might noticed the icon for “Order Date” table (
 ) is a bit different than the normal table icon (
 ) as the new table is a calculated table
 - Create two more calculated tables for “Ship Date” and “Due Date” using the same expression
- Click “Relationships” to create new relations between the calculated tables we created and “Internet Sales” table
We are done now. We have all roles in our model.
- Put a column chart on the report and put “Fiscal Year” column from “Order Date” to the chart axis then put “Sales Amount” from “Internet Sales” on values. (You can create an explicit measure for “Sales Amount” but for simplicity I keep using the implicit one.)
- Repeat this for the other two date dimensions
You can hide the “Date” dimension in data model, or you can unload it in the Power Query layer to reduce the complexity of the model.
Role Playing Dimensions in DirectQuery Mode
Although the DirectQuery is an awesome feature in Power BI it has some few limitations. One of them is that we CANNOT create calculated tables. So we have to go for an alternative solution.
Note: You can learn more about DirectQuery here. But, some information is out-dated as in the new release of Power BI some of the limitations like creating calculated column and calculated measure are resolved. So the limitation on creating a calculated table in DirctQuery model might bet resolved in the next releases of Power BI. (Power BI Desktop current version: Version: 2.33.4337.281 64-bit (March 2016)).
Let’s get the job done in DirectQuery.
The first steps of getting data are the same just you need to select “DirecyQuery” in “Connection Settings” page instead of “Import”.
After loading the model follow the steps below:
- Click “Edit Queries” from “Home” tab from the ribbon
- Rename DimDate and FactInternetSales to user friendly names
- Right click on “Date” and select “Reference”
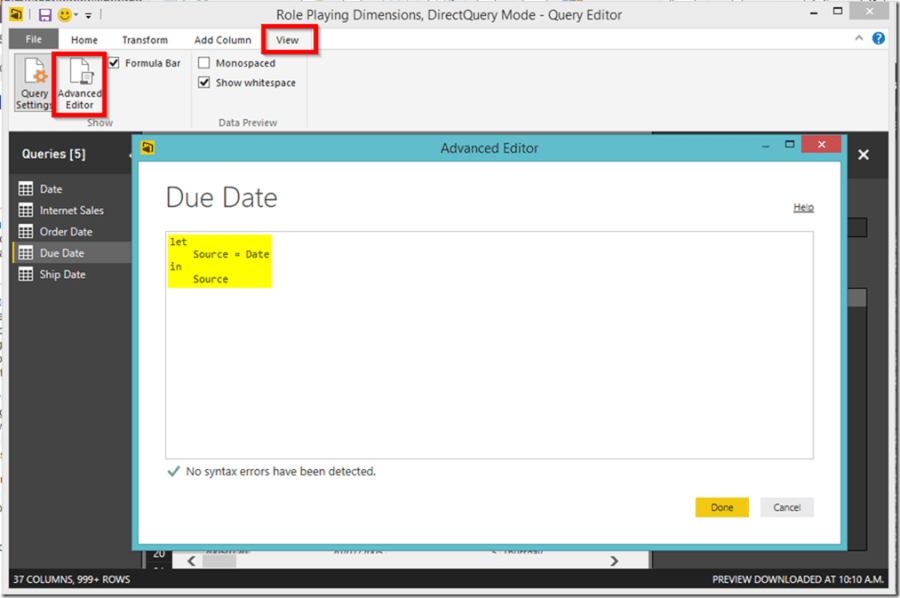
- If you want to see the Power Query “M” scripts behind the seen for a reference table click on “Advanced Editor” from “View” tab
- Rename the reference table to “Order Date”
- Repeat this and create Due Date and Ship Date reference tables
- Click “Close & Apply”
- Switch to “Relationships” view
- Keep just the correct relationships and remove unwanted ones between “Order Date”, “Due Date”, “Ship Date” and “Internet Sales”
Alright, we have all the role playing dimensions in our model. You can hide the “Date” dimension in data model, or you can unload it in the Power Query layer to reduce the complexity of the model.
Pros and Cons:
Pros:
1- If your model is a small model then you can quickly import new role playing dimensions into the model either in Import Mode or DirectQuery Mode, creating relationships and you’re ready to go
2- It may be easier for the end user to have different Date options. You will have separate slicers in the Power BI. However, you’ll need to take care of filter interactivities and cross filtering which means more development time.
3- You will have just one measure to be sliced and diced by different roles separately
Cons:
1- If your model is not small and you have much more role playing dimensions to manage then you’ll end up importing the dimensions several times which is not efficient
2- Having lots of different role playing dimensions as separate tables all over the model will be really confusing for the end user and you will really need to spend more time/money to train the end users. It is also quite hard to maintain such a big model with lots of role playing dimensions
3- You consume more storage and memory which is again not that efficient
Bottomline:
At the end of the day it really depends on your customer needs. Read more about the other method to manage Role Playing Dimensions here.
All done!
Discover more from BI Insight
Subscribe to get the latest posts sent to your email.


