
I previously explained in a blog post what thin reports are and why we should care about them. I also explained Report Level Measures in another blog post. In this post, I try to raise some real-world challenges we face when developing thin reports. I also provide a solution to those challenges.
Report Level Measure Related Challenges #
Creating and using Report Level Measures is relatively easy, but there are some challenges that we face from time to time, such as:
- Distinguishing Report Level Measures from Dataset Level Measures
- Report Level Measure dependencies
Determining Report Level Measures from Dataset Level Measures #
One of the challenges that Power BI Developers face is creating many report level measures. Unfortunately, Power BI Desktop currently uses the same iconography for both types of measures, making it hard to distinguish the actual measures created within the dataset from the report level measures. It gets even more challenging if we need to write technical documentation for an existing thin report. We have to open the PBIX file of the thin report in the Power BI Desktop and click every single measure. If the expression bar appears, the selected measure is a report level measure; otherwise, it is a dataset level measure.
So unless we use third-party tools, which I explain in this post, we must go through the manual process.
Report Level Measure dependencies #
Another pain point related to the previous challenge is finding the dependencies between the report level measures. It is crucial to be aware of the interdependencies when doing impact analysis. We need to understand how a change in a report level measure impacts other report level measures. Again, Power BI Desktop does not currently have any options supporting that, so we have to click every measure and read through the DAX expressions to identify the dependencies or use the third-party tools to save development time.
Dataset and Thin Reports Dependency Challenges #
The other challenges are even more difficult to overcome relate to interdependencies between datasets and thin reports. Power BI Service provides a lineage view that shows the dependencies between a dataset and its connected thin reports. But the challenges can get more complex to overcome manually. The following are some real-world examples of more complex situations:
- What if we need to analyse the impact of changes in a dataset measure on all report level measures of the connected thin reports?
- How do we analyse the impact of changes on a dataset measure on all connected thin reports, including the visuals, filters, etc…?
- What if we need to tune the performance and we want to find a list of all unused tables or unused fields?
As you can see, the situation can get pretty complex, so manual operations are virtually impossible.
But there is a third party tool we can use which provides heaps of capabilities with a couple of clicks.
Introducing A Third Party Tool That Can Help #
Fortunately, there is a third party tool that can help to resolve all the above challenges. The Data Vizioner team, myself included, worked hard to implement an add-on for Power BI Documenter that supports thin reports. Let’s get to it and see how it works.
Getting a List of Report Level Measures and Their DAX Expressions using Power BI Documenter #
We can currently use the out-of-box feature to get all report level measures and their DAX expressions in the Power BI Documenter without activating any add-ons. All you need to do is create an account if you haven’t already done so. As you may know, Power BI Documenter currently accepts Power BI Template files (PBIT); so you need to open the thin report in Power BI Desktop and export it to PBIT, then follow these steps:
- Login to Power BI Documenter
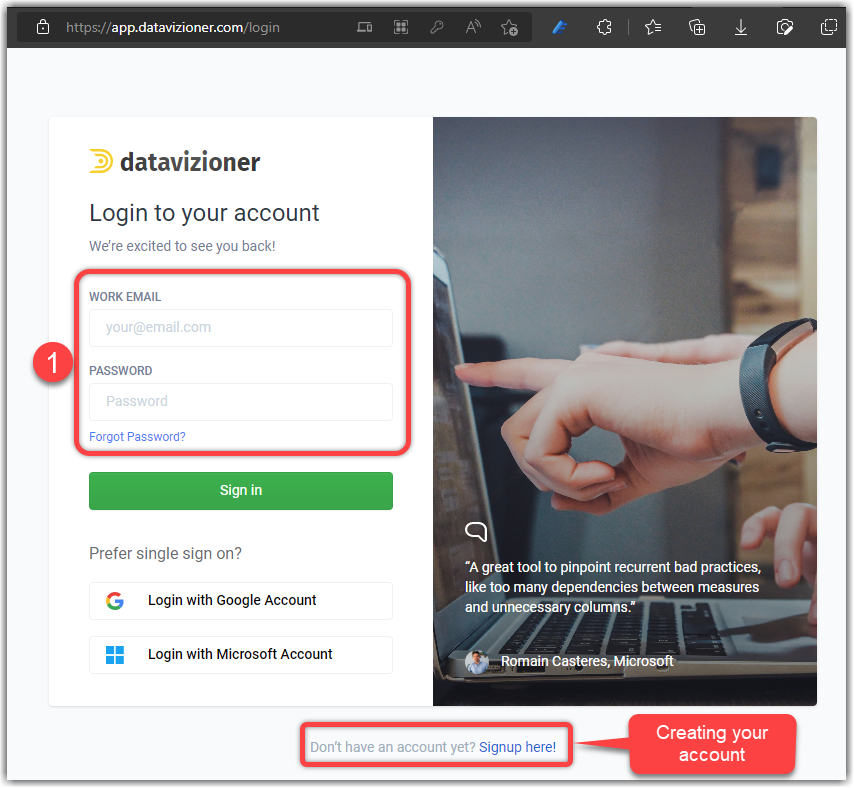
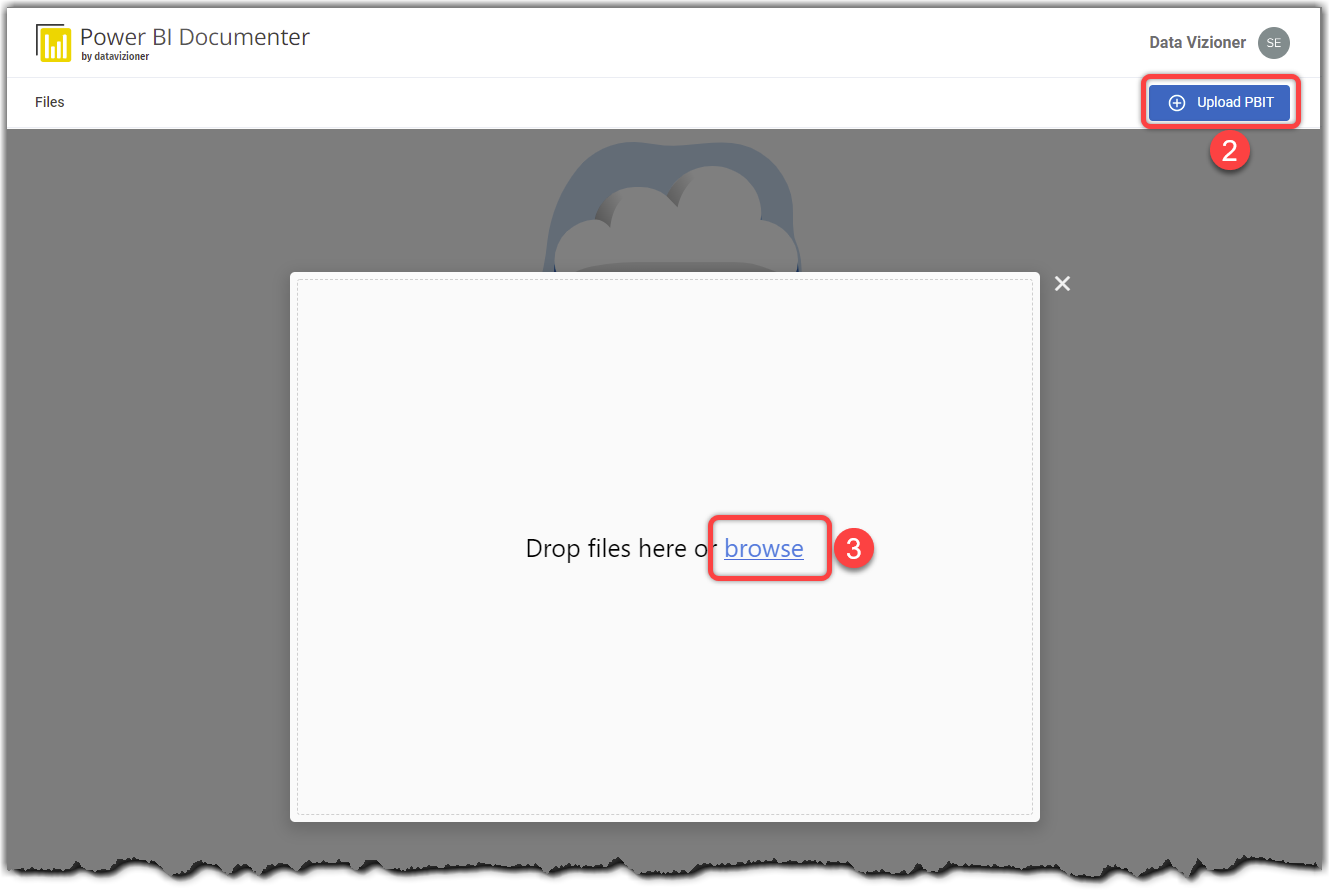
- Click the Upload PBIT button
- Click Browse and select the PBIT file to upload
- The Documenter detects the report type is a thin report
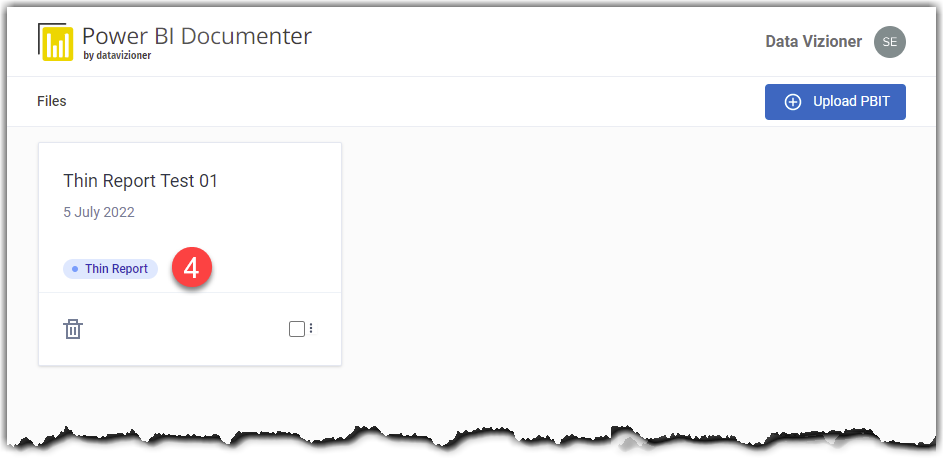
- Click the thin report and navigate to the Model tab
- Expand the Report Level Measures section
- Click the Download as CSV file button
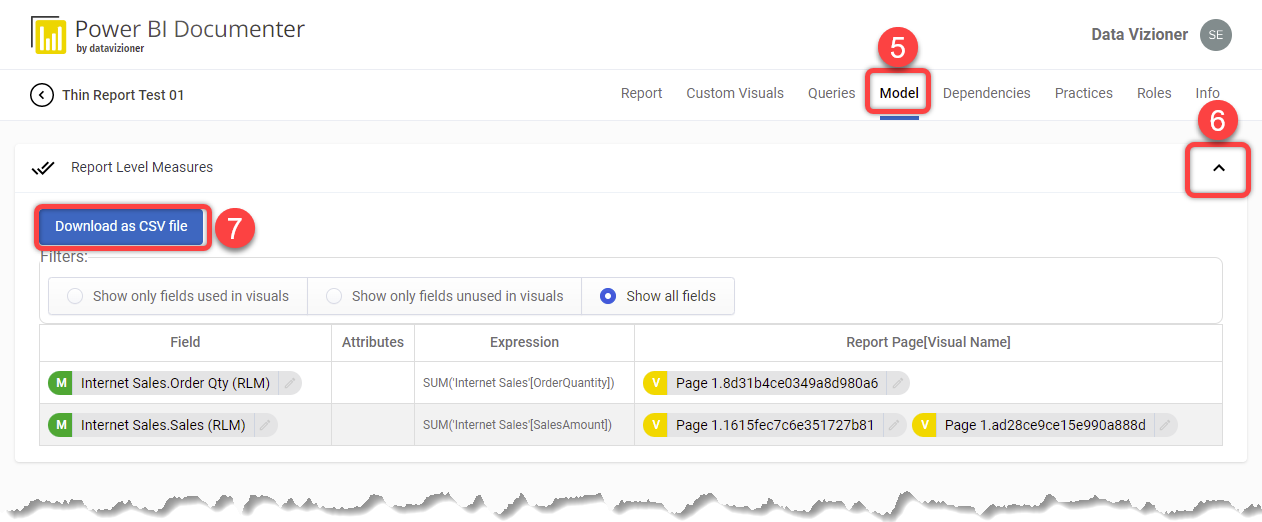
As shown in the preceding image, you can see the report level measures, their DAX expressions, and the visuals using them.
But wait, what about the other challenges we just discussed, the dataset to all thin reports dependencies, used and unused fields, etc?
Let us see how Power BI Documenter can help with those.
Thin Report Add-on for Power BI Documenter #
As mentioned, we worked hard at Data Vizioner to prepare an add-on for Power BI Documenter. After activating the add-on on your Power BI Documenter account, a new Analyse button appears on the top right of the Files page.
Let us upload multiple thin reports and their related dataset files (PBIT) in the Documenter and see how easy it is to get all the dependencies in a couple of clicks:
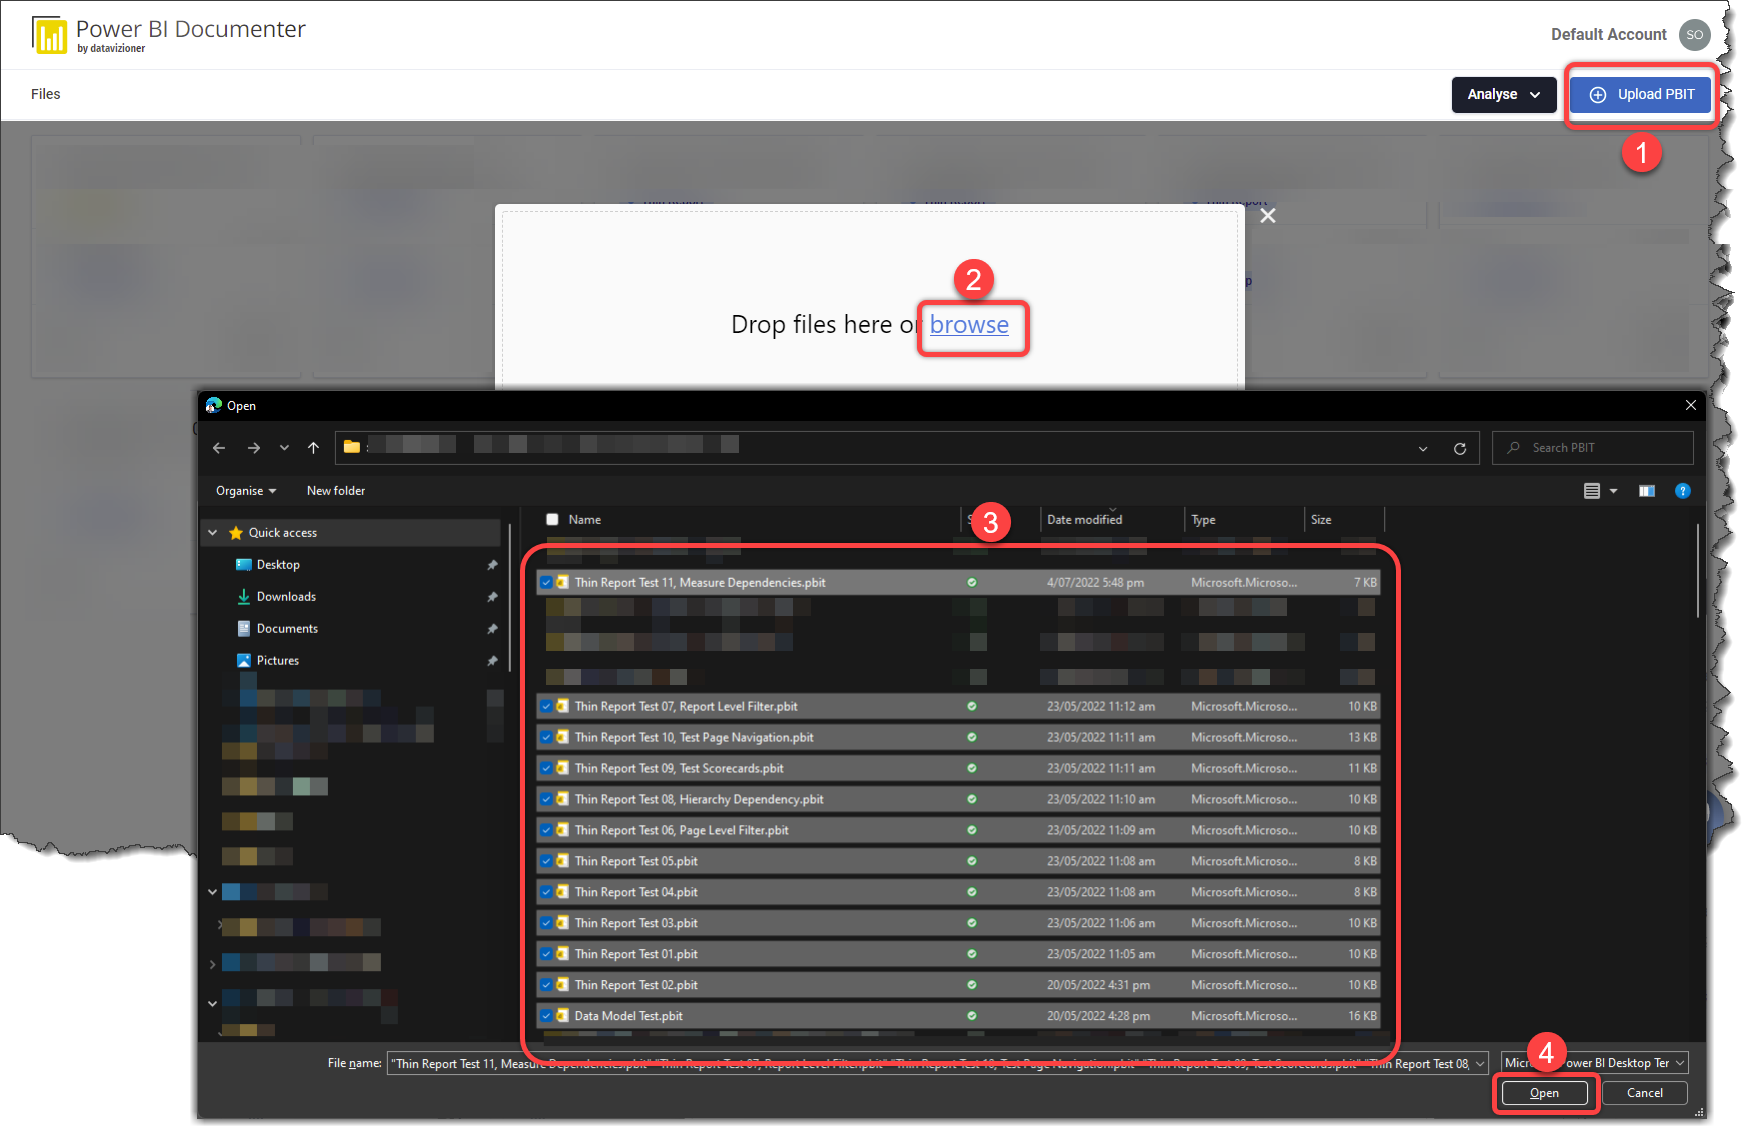
- Click the Upload PBIT file button
- Click Browse
- Select all required PBIT files, including the PBIT containing the dataset and all related thin reports
- Click Open
After the files are uploaded into the documented, the documented automatically detects the file type as below:
- Full Report

- Dataset

- Thin Report

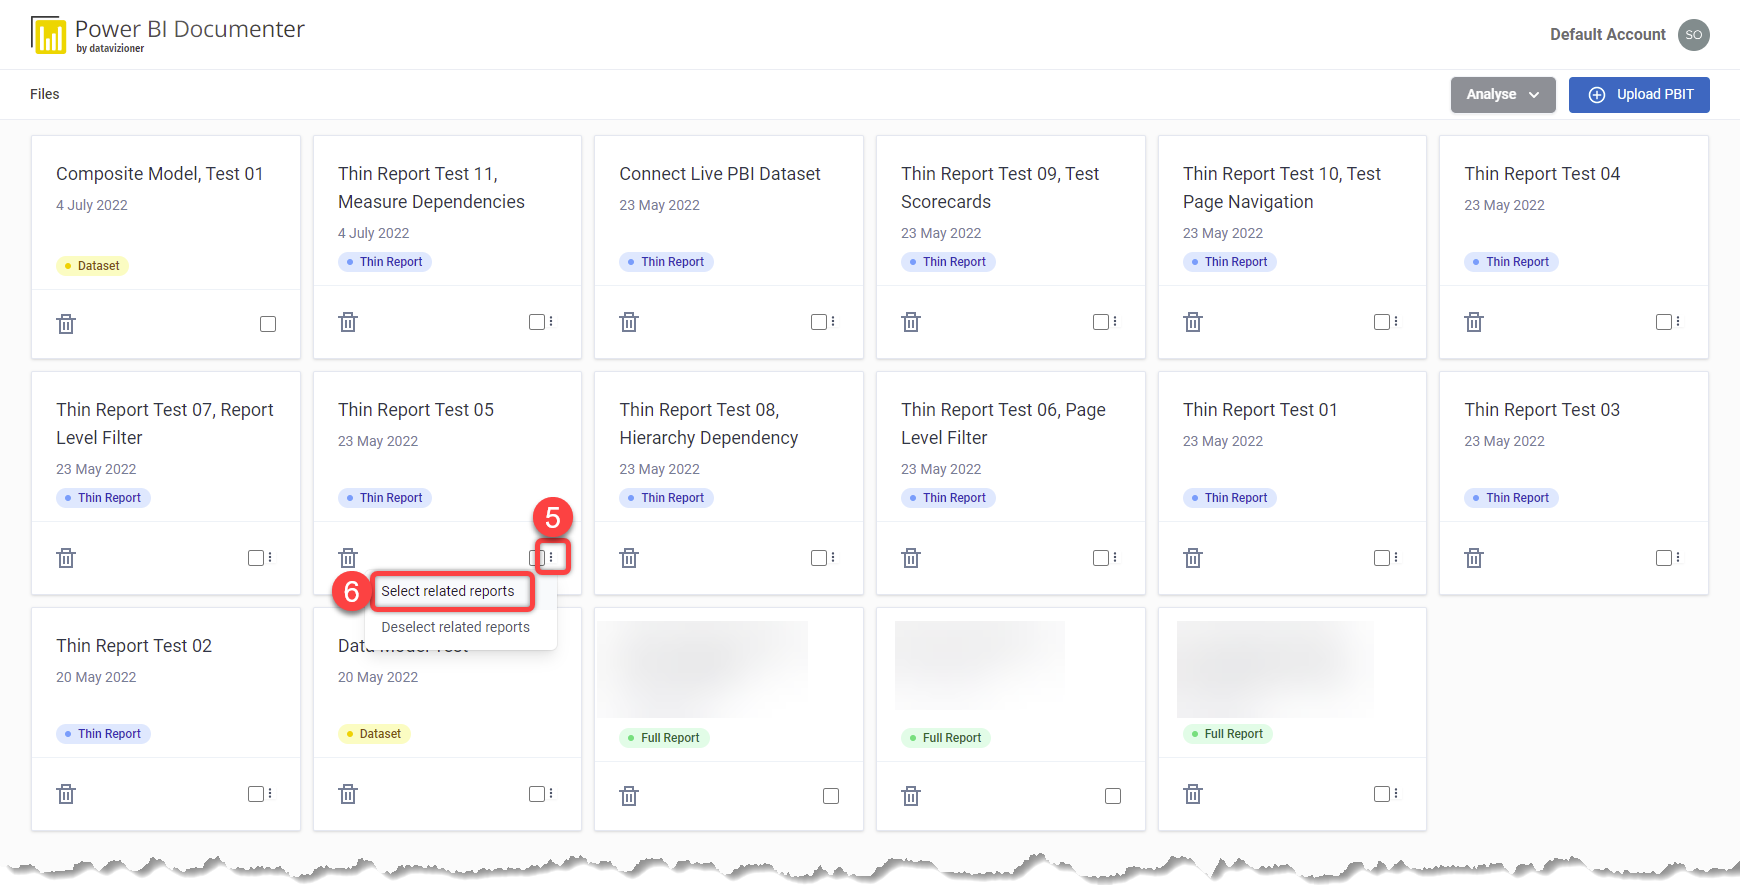
Now, let us select the dataset and all related thin reports:
- Click the ellipsis button on the desired file
- Click the Select related reports from the context menu
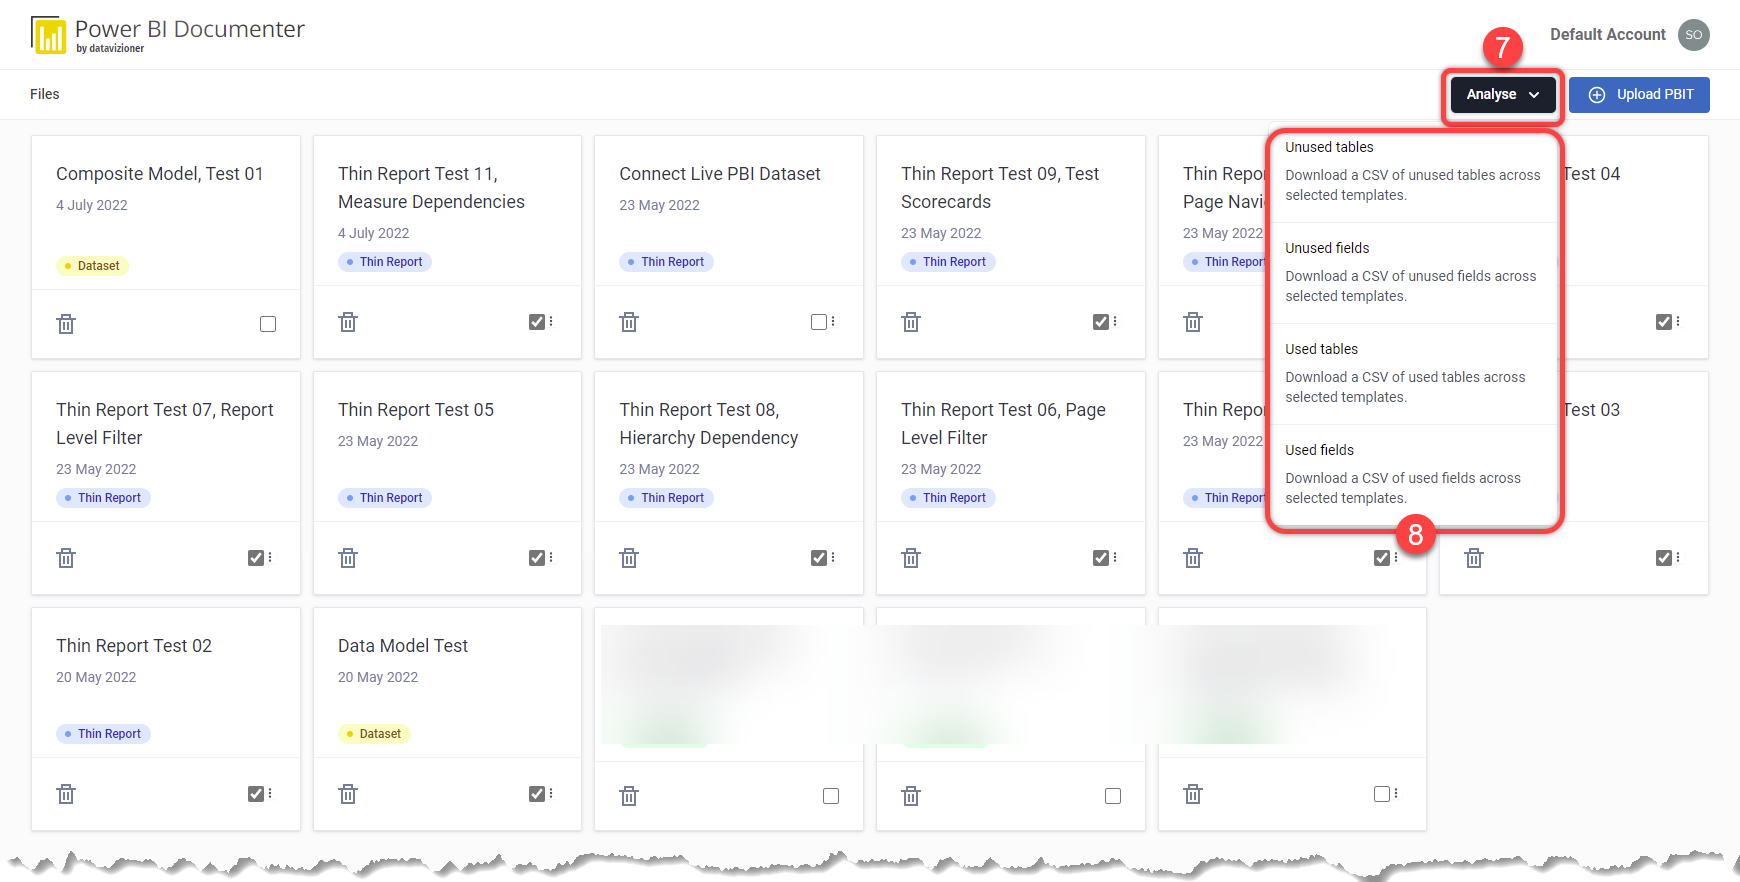
- Now that all related reports and their dataset are selected, click the Analyse button
- Select the desired option from the menu, the Documenter currently supports the following four options:
- Unused tables: downloads a CSV file containing a list of the tables from the dataset that none of their fields is used anywhere across the dataset itself and all selected thin reports
- Unused fields: downloads a CSV file containing a list of all unused fields including columns, calculated columns, measures, and report level measures
- Used tables: downloads a CSV file containing a list of the tables that at least one of their fields is used somewhere within the dataset itself or any of the selected thin reports
- Used fields: downloads a CSV file containing a list of the fields that are used somewhere either within the dataset or any of the selected thin reports or their report level measures
There you go! You have it. In the next section, we explain what the CSV files give us.
The Definition of Used and Unused #
As the preceding image shows, we analyse the data into the following four categories:
- Unused tables
- Unused fields
- Used tables
- Used fields
To understand these categories we have to have a definition for used objects where the objects are Tabular model objects. We currently do not factor the Power Query objects and their interdependencies in the analysis. So, while we have confidence in the output, it is important for the users to understand that they need to sense check before deleting the unused objects from their model.
The Definition of Used Fields’ definition will change as we add additional functions, so always check for the latest definition.
The Definition of Used Fields #
A field, from a Tabular object model perspective, includes columns, calculated columns, and measures. A used field is a field that appears in any of the following across the dataset and all thin reports selected by the user:
- Dataset level dependencies
- Relationships
- Tabular object dependencies in DAX
- Calculated column expressions
- Measure expressions
- Calculated table expressions
- Calculation groups
- Security
- Row Level Security (RLS)
- Object Level Security (OLS)
- Sort by column
- Report level dependencies
- Filters
- Report filters
- Page filters
- Visual filters
- Anywhere on Visuals including but not limited to
- Axis or values
- Conditional formatting
- Dynamic conditional formatting
- Tooltips
- Report level measures
- Report level measure’s dependencies
- Dependency on other report level measures
- Dependency on dataset fields
- Filters
The Definition of Unused Fields #
By having the definition of the used fields on hand, the unused ones are those fields that do not appear in the list of used fields.
The Definition of Used and Unused Tables #
A used table is a table with at least one field appearing in the list of used fields. Conversely, an unused table is a table with no fields appearing in the used fields’ list.
Understanding the CSV Output #
As you may have already noted, identifying the dependencies between dataset objects and all connected thin reports is a complex process. So the size of generated CSV file varies depending on the dataset size, its complexity, the number of connected thin reports, and their complexity. We are also aware that CSV is not the easiest format to understand and interpret the information, so we aim to prepare a user-friendly UI in the future. But for now, let’s pick one option and see what we get in the CSV file and how to interpret the data.
In my sample, I selected a dataset and 11 thin reports. The following image shows the results in the downloaded CSV file for Used Fields looks like the below when opened in Excel:

We can filter the title to answer many questions such as the following:
What report level measures do we have in all thin reports? #
To answer this question we just need to filter the CSV when the Type column is REPORT_MEASURE. The following image shows the results:

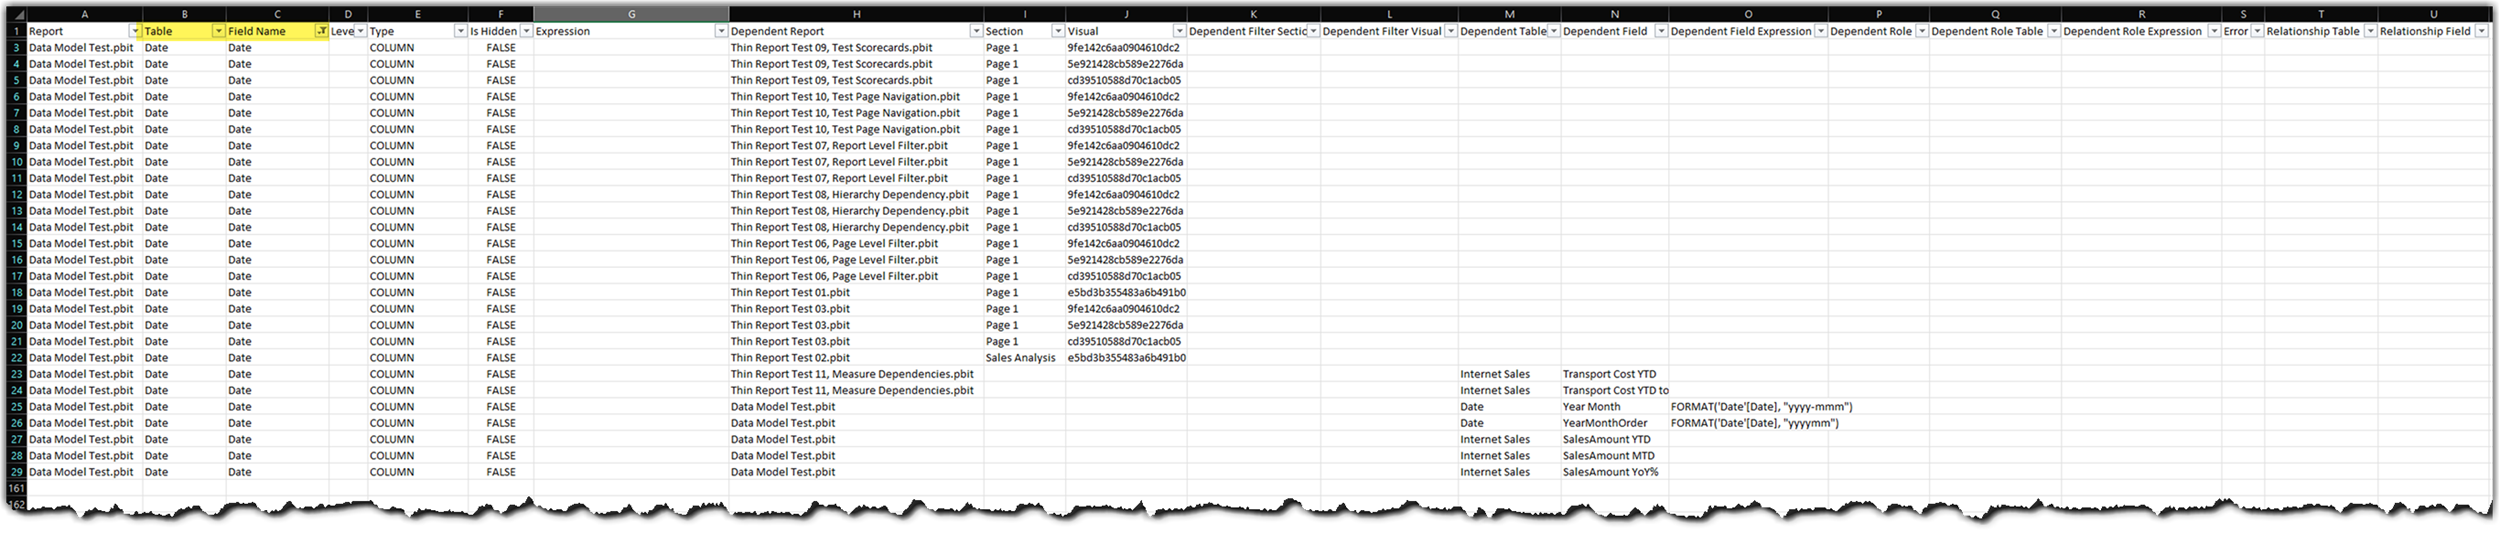
Where the Date column from the Date table is used across the dataset and thin reports? #
To answer this question we need to filter the CSV when both the Table and Type columns’ value is Date. The following image shows the results:
What is the impact of changing the Transport Cost, a dataset measure, on report level measures? #
To answer this question we just need to filter the CSV as follows:
- Filter the Field Name column to Transport Cost
- Filter the Type column to Measure
- Filter the Dependent Report column and exclude Blanks
- Filter the Dependent Field Expression column and exclude Blanks
The following image shows the results:

These are only a few examples of questions we can answer using the CSV output of the Thin Report add-on in the Power BI Documenter as you can imagine. For more information about how the Thin Report add-on works watch the following short video:
Do you like what you see? If your answer is yes, continue reading.
Enabling Thin Report Add-on in Power BI Documenter #
As the name of this feature implies it is an add-on that you can enable on your Power BI Documenter account. We currently enable this add-on only via request. I hear you ask Why? As mentioned earlier, the process of identifying all interdependencies between the dataset objects and all thin report objects is pretty resource-intensive that can cost us a lot of money. So we cannot enable it for thousands of users. You don’t want to see us bankrupted, do you? So I encourage you to express your interest by filling out the following form and we get back to you as soon as we process your request:
As always, I would love to hear your thoughts. So please leave your message in the comments section below.
Discover more from BI Insight
Subscribe to get the latest posts sent to your email.